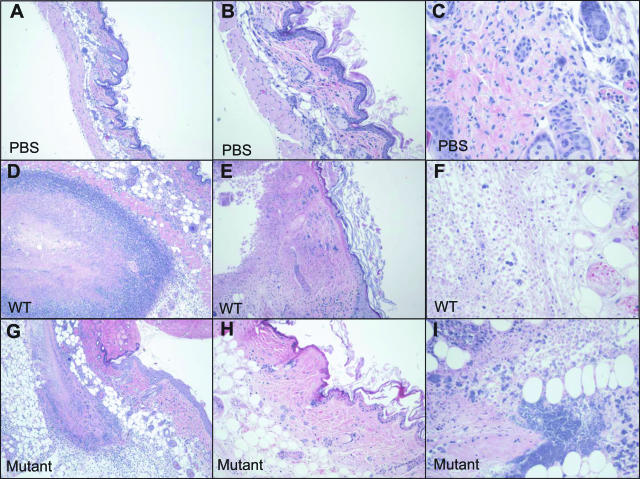
Figure 1.
Histopathological assessment of GAS mouse skin infection. Photomicrographs of H&E-stained, formalin-fixed tissue biopsies taken from PBS-inoculated (control) animals (top row), strain MGAS5005 (WT)-infected animals (middle row), and animals infected with ΔcovR mutant strain JRS950 (bottom row) at 2 days after inoculation. Results are representative of tissues obtained from animals in each of the groups. Additional histopathology and gram stains of biopsies from the same animals (D, G) are depicted in Figure 2, B and E and C and F, respectively. Original magnifications: ×40 (A, D, G); ×100 (B, E, H); ×200 (C, F, I).

