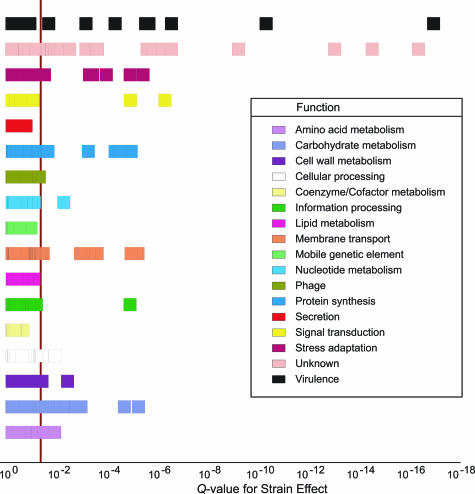
Figure 3.
Analysis of variance revealed a significant strain effect in the in vivo microarray expression data. The depicted box plot shows the confidence of calls for strain effect in Q values (P values adjusted for multiple testing using false discovery rate) on the horizontal axis versus GAS functional category. A vertical line delineates the statistical significance threshold (Q < 0.05) for differentially expressed GAS transcripts in WT versus ΔcovR mutant strain. The 76 identified differential transcripts in the in vivo transcriptome data are primarily associated with carbohydrate metabolism, membrane transport, signal transduction, stress adaptation, unknown functions, and virulence.

