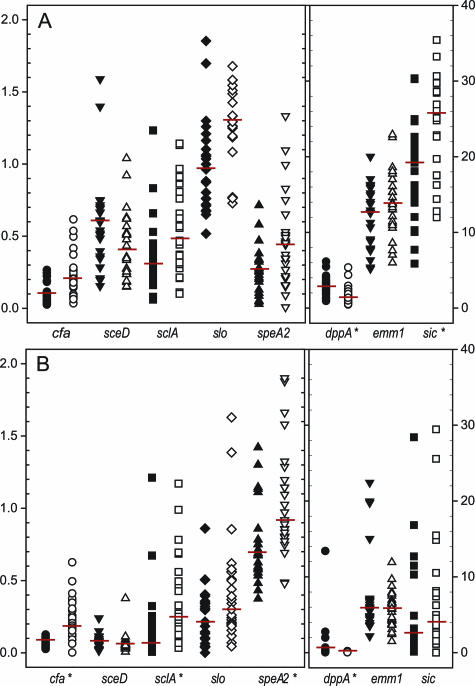
Figure 4.
Verification of representative oligonucleotide microarray transcriptome data. Depicted are GAS expression estimates for eight selected GAS transcripts, as obtained by RMLChip microarray experiments (A) and real-time RT-PCR (TaqMan) assays (B). Results depicted summarize the analysis of 49 mice infected with either WT strain MGAS5005 (n = 23; closed symbols) or the isogenic covR mutant (n = 26; open symbols) and are expressed as median expression relative to the reference transcript proS (M5005_spy1673). Asterisks depict transcripts detected as differentially expressed at Q ≤ 0.001 in arrays (A) and in TaqMan assays at P ≤ 0.001 according to the Mann-Whitney rank sum test (B).

