Figure 6.
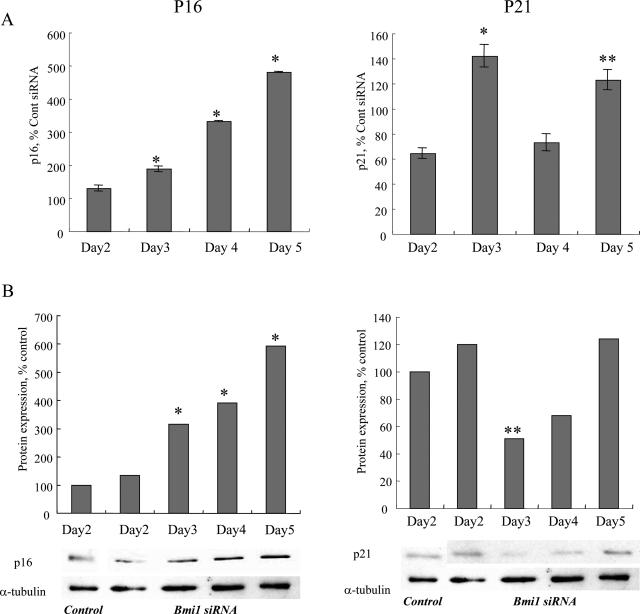
The effect of bmi1 knockdown on p16INK4a and p21WAF1/Cip expression. A: P16INK4a mRNA expression was significantly higher in BECs transfected with siRNA targeting bmi1 on days 3, 4, and 5 (left). P21WAF1/Cip mRNA was significantly higher on days 3 and 5 after siRNA transfection. P16INK4a and p21WAF1/Cip mRNA was quantified with real-time PCR. The expression was normalized as a ratio using GAPDH as a housekeeping gene and was shown as percentage of control. Data are expressed as the mean ± SD. *P < 0.01, **P < 0.05 compared to the control, n = 3 for each group. B: Immunoblot for p16INK4a and p21WAF1/Cip protein expression in BECs transfected with siRNA targeting bmi1 and a control siRNA. The intensity of each band in immunoblot analysis was quantified by densitometry, normalized as a ratio using α-tubulin as an internal control and statistically analyzed. P16INK4a protein expression was significantly higher in BECs on days 3, 4, and 5 after bmi1 siRNA transfection (left). P21WAF1/Cip protein expression was low on day 3 after siRNA transfection. *P < 0.01, **P < 0.05 compared to the control. Three independent experiments showed similar results.

