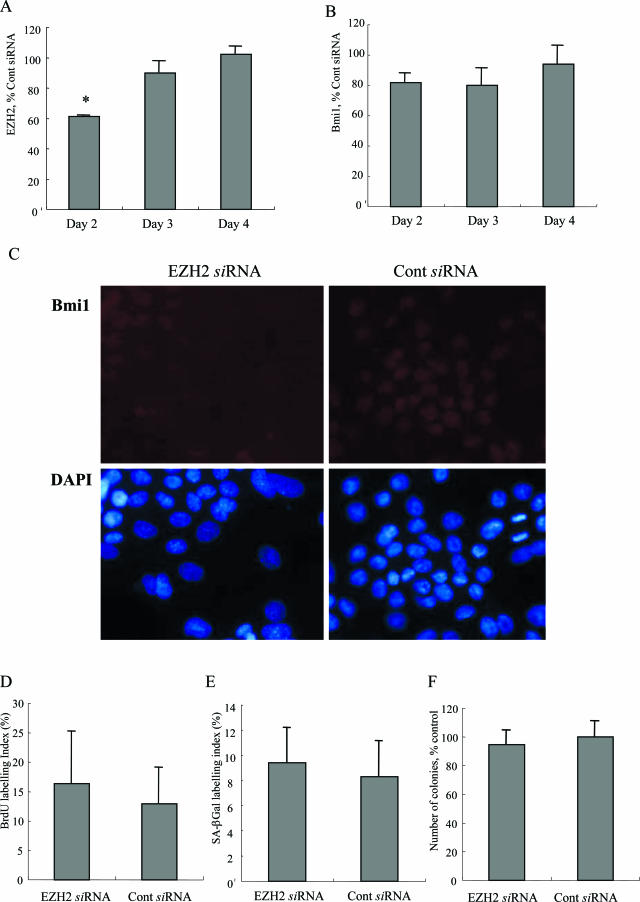
Figure 9.
The knockdown of EZH2 slightly decreases the nuclear expression of bmi1 but does not affect cell proliferation and cellular senescence. A: EZH2 mRNA expression was significantly lower in BECs transfected with siRNA targeting EZH2 on day 2. EZH2 mRNA was quantified with real-time PCR. The expression was normalized as a ratio using GAPDH as a housekeeping gene. Data are expressed as the mean ± SD. *P < 0.01 compared to the control, n = 3 for each group. B: bmi1 mRNA expression was slightly lower in BECs transfected with siRNA targeting EZH2 on days 2, 3, and 4, but there was no statistical difference. bmi1 mRNA was quantified with real-time PCR. The expression was normalized as a ratio using GAPDH as a housekeeping gene. Data are expressed as the mean ± SD. C: The nuclear expression of bmi1 labeled by red fluorescence was decreased in the cells transfected with EZH2 siRNA (left), when compared with the cells transfected with control siRNA (right). Day 4 after transfection. D: The labeling index of BrdU was not significantly different in BECs transfected with EZH2 siRNA (16.3 ± 8.8%), when compared with BECs transfected with control siRNA (12.9 ± 6.0%). Data are expressed as the mean ± SD. The labeling index of BrdU was counted for at least 1000 cells in each group. Day 4 after transfection. E: Percentage of cells positive for SA-β-Gal activity was not significantly different in BECs transfected with EZH2 siRNA, when compared with BECs transfected with control siRNA. Data are expressed as the mean ± SD. Day 6 after transfection. F: Number of colonies was not significantly different in BECs transfected with EZH2 siRNA, when compared with BECs transfected with control siRNA. Data are expressed as the mean ± SD. Day 6 after transfection.

