FIGURE 1.
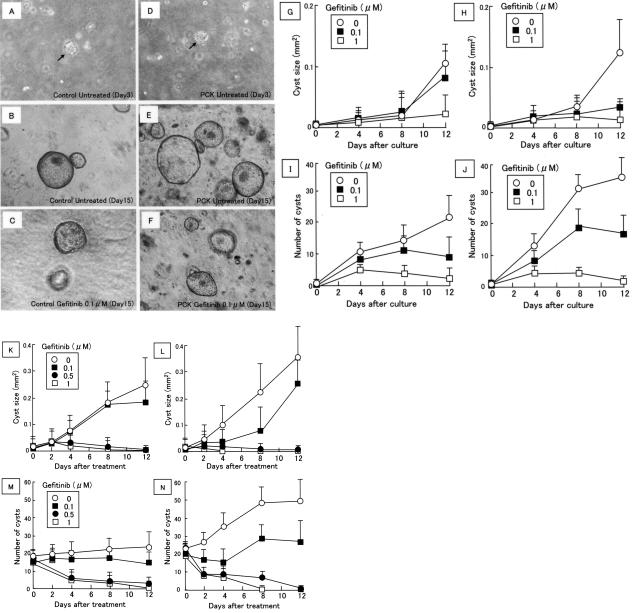
Inhibitory effects of gefitinib on cyst formation of cultured rat BECs. BECs were obtained from the control and PCK rats, and the three-dimensional cell culture system was used for the analysis. Gefitinib (0 to 1 μmol/L) was administrated at the beginning of the three-dimensional cell culture (G–J) and on day 7 after the beginning of the culture (K–N), and the size and number of biliary cysts were monitored. A–F: Representative photographs of the biliary cysts in collagen gel matrix (A–C, control rats; D–F, PCK rats). Day 15 (C and F) is equal to day 8 after gefitinib treatment. Arrows (A and D) indicate biliary microcysts. G, H, K, and L: Time course of the size of biliary cysts (G and K, control rats; H and L, PCK rats). I, J, M, and N: Time course of the number of biliary cysts (I and M, control rats; J and N, PCK rats). Data represent the mean ± SD in three sets (G–N). Phase-contrast microscope. Original magnifications, ×40.

