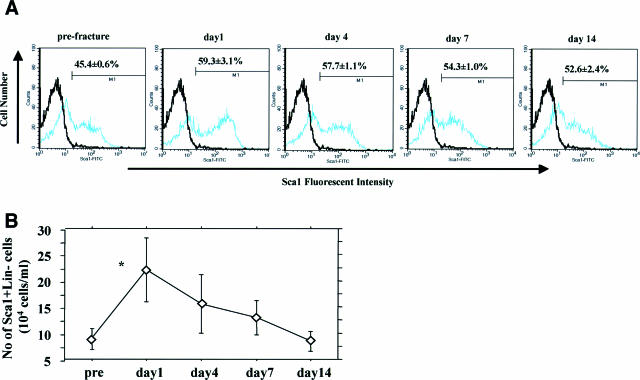
FIGURE 1.
Mobilization of mouse ScaI+Lin− cells by fracture stress. A: Percentage of peripheral blood ScaI+Lin− cells to Lin− MNCs shows an increase with the peak at day 1 after fracture. Black line represents isotype control (negative control), and blue line indicates sample data. x axis shows fluorescent intensity of cells, and y axis demonstrates the number of cells. B: Number of ScaI+Lin− cells significantly peaked at day 1 after fracture and then gradually decreased. *P < 0.05.

