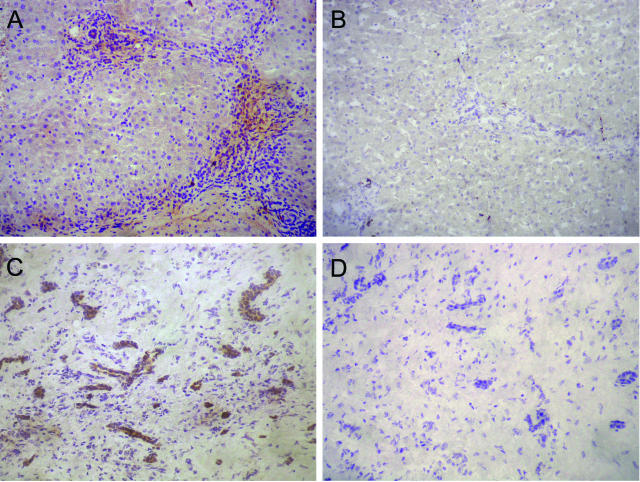
FIGURE 3.
Ang2 expression pattern in liver tissue samples. Immunoperoxidase analysis of Ang2 protein expression in hepatic specimens shows a marked positive staining in the inflamed portal tracts of CHB liver tissue sections (A), mostly related to the mononuclear inflammatory infiltrate. Ang2 expression was negative in control normal liver (B) but clearly positive in vascular structures of HCC samples (C); as expected, an absence of immunoreactivity was observed in the same HCC sample (D) without using the primary anti-Ang2-specific antibody SC-7015. Original magnifications, ×200.

