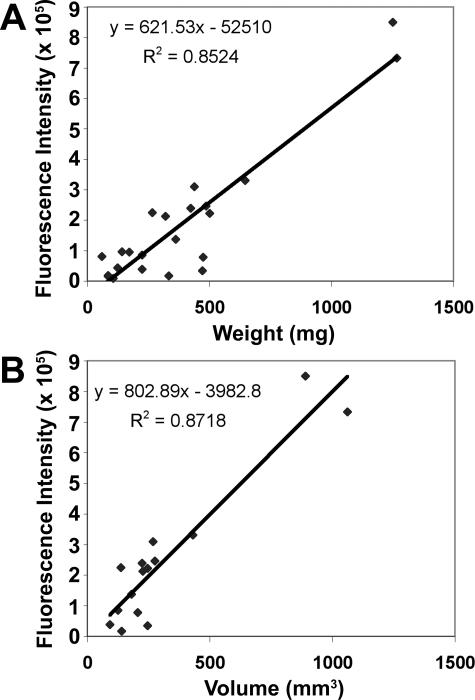
FIGURE 5.
Correlation of optical imaging parameters with endpoint tumor size. Excised orthotopic prostate tumors of varying sizes from a total of 22 animals were weighed and measured with standard digital calipers to determine volume. Mean fluorescence intensity was determined for the total tumor region above the incision line. Linear regression analysis was performed using total fluorescence relative to wet weight (A) or caliper volume (B).

