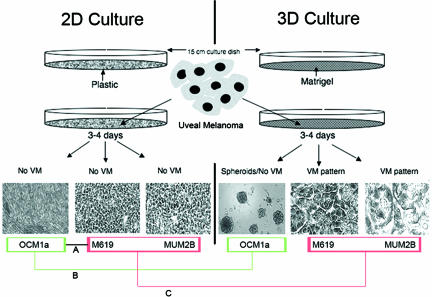
FIGURE 1.
Schematic of the experimental design for comparing gene expression in uveal cells in 2D culture conditions on plastic versus 3D cultures on thick Matrigel, permissive of vasculogenic mimicry pattern formation. After 3 to 4 days, neither the poorly invasive OCM1a primary uveal melanoma cells, the highly invasive M619 primary uveal melanoma cells, nor the highly invasive MUM2B metastatic uveal melanoma cells generated vasculogenic mimicry (VM) patterns in 2D cultures on plastic. However, in the same time period, M619 and MUM2B cells generated looping patterns surrounding clusters of tumor cells characteristic of VM of the patterned matrix type in 3D Matrigel cultures. Cells were harvested at 3 to 4 days and prepared for gene expression profiling as described in the Materials and Methods. First, gene expression in OCM1a (bordered in green) was compared with gene expression in M619 and MUM2B cells (bordered in red, comparison A; also see Supplementary Data Table 1, http://ajp.amjpathol.org). Next, gene expression in OCM1a cells in 2D was compared with the same cells in 3D Matrigel cultures that failed to generate VM patterns in these conditions (comparison B). Finally, gene expression of M619 and MUM2B cells that did not generate VM patterns in 2D culture conditions was compared with the same cells after they generated VM patterns in 3D culture conditions (comparison C). Genes from comparison B were subtracted from comparison C to generate Supplementary Data Table 2 (see http://ajp.amjpathol.org).

