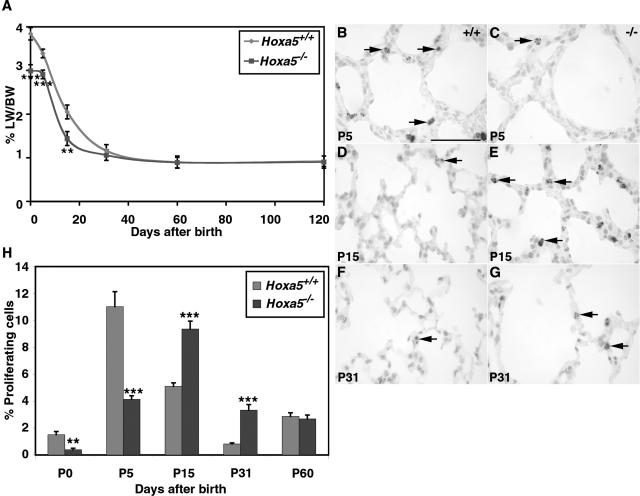
FIGURE 2.
Lung weight/body weight ratio (A) and proliferation rate (B–H) of wild-type and Hoxa5−/− lungs. A: The lung weight/body weight (LW/BW) ratio of Hoxa5−/− mutants was statistically lower than that of controls at P0, P5, and P15. However, a compensatory effect was observed from P31 onwards. Detection of proliferating cells with an anti-phosphorylated histone H3 antibody (B–G, arrows) showed that proliferation was lower in Hoxa5−/− specimens compared with wild-type lungs at P0 (H) and P5 (B, C, H). At P15 (D, E, H) and P31 (F–H), more proliferating cells were detected in mutant lungs than in controls. H: No difference was observed at P60 between both groups. Statistically significant differences are denoted by asterisks (**P < 0.0075, ***P < 0.0006). Scale bar = 50 μm.

