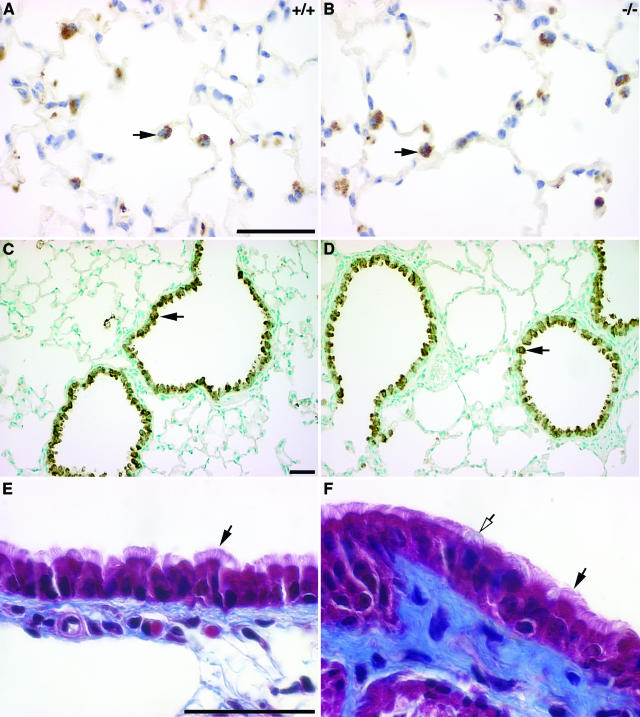
FIGURE 3.
Correct specification of type II pneumocytes (A, B), Clara cells (C, D), and ciliated cells (E, F) in Hoxa5−/− lungs. No major difference was detectable between wild-type and Hoxa5−/− lungs regarding type II pneumocytes and Clara cells as shown by immunostaining with SP-B (A, B) and CC-10 (C, D) antibodies specific for these cell types, respectively (black arrows, shown for P60). Masson’s trichrome revealed that ciliated cells (black arrows) were similarly distributed in mutant (E) and wild-type lungs (F). However, mucus-producing goblet cells were more often visualized in mutant samples (F, open arrow). Scale bars = 50 μm.

