
Fig. 3.
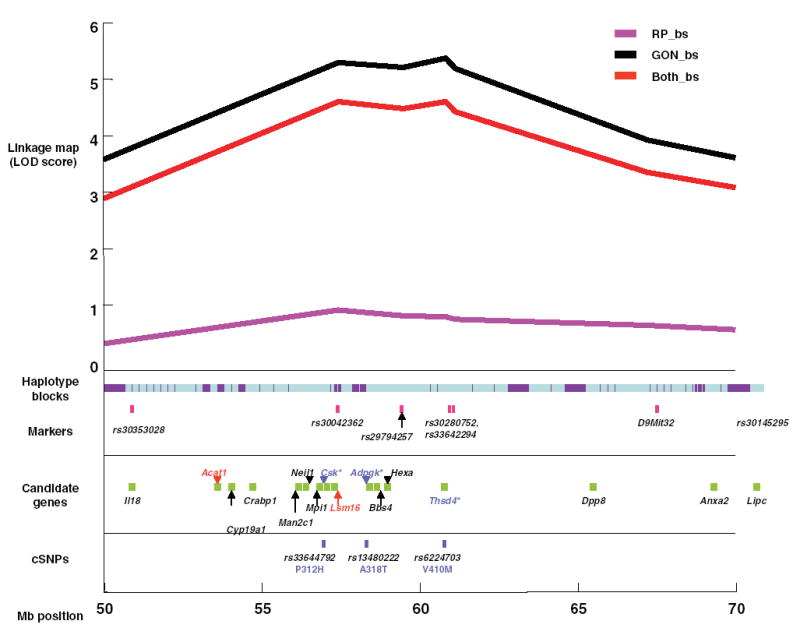
Detailed map of linkage peak region (50–70 Mb). The linkage peak was anchored to markers within 10 Mb from the peak. The haplotype blocks are displayed under the linkage map with light blue demonstrating discordant regions and purple demonstrating regions of concordance. Markers used in mapping the chromosome are displayed in pink immediately under the haplotype blocks. Beneath the markers, candidate genes that were chosen for their functional significance (Table 4) are displayed as follows: gene names in red are lower-priority candidates, gene names in black are medium-priority candidates, and gene names in blue are the highest-priority candidates. Directly beneath the candidate genes are the known cSNPs located within the sequence of the highest priority candidates. The amino acid residue changes and their positions within the polypeptide sequence of the resulting protein are also in blue under the SNP identifier. The approximate position of the map is shown in 5-Mb increments (bottom).