
Figure 3.
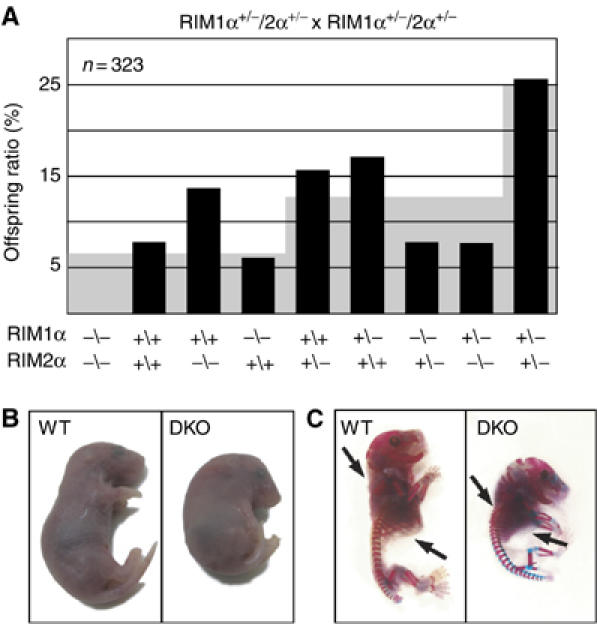
(A) Survival analysis of the offspring from matings of double heterozygous RIM1α/2α mutant mice. The black bars plot the observed frequency of the indicated genotypes as percentage of the total, whereas the gray background indicates the expected frequency based on Mendelian inheritance (N=323). (B, C) Images of E18.5 RIM1α/2α DKO mutant and control littermate mice overall morphology (B) and skeleton (C, bones are stained in blue and cartilage in pink; black arrows point to ribcage and cervical vertebrae).