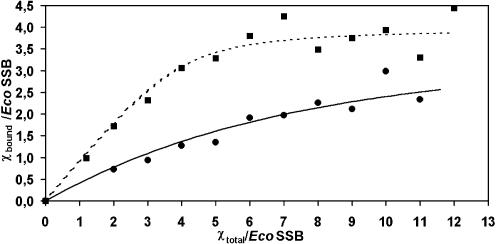
Figure 2.
Interaction of EcoSSB or EcoSSB/poly(dT) complex with χ in low salt. 0.5 µM EcoSSB (circles) or a complex of 0.5 µM EcoSSB and 17.5 µM nucleotides of poly(dT) (squares) in 5 mM NaCl, 5 mM potassium phosphate pH 7.4, 0.67 M glycerol were mixed with different concentrations of χ and analyzed in an analytical ultracentrifuge. Free and bound χ concentrations were determined from the sedimentation velocity profiles fitted to a sum of two integrated Gaussian distributions (26). The lines represent the best non-linear least-squares fit with a simple interaction model of n χ molecules with one EcoSSB tetramer using the following parameters: n = 4, K = (4.0 ± 1) × 105 M–1 (solid line); n = 4, K = (7.4 ± 1) × 106 M–1 (dotted line).

