
Figure 5.
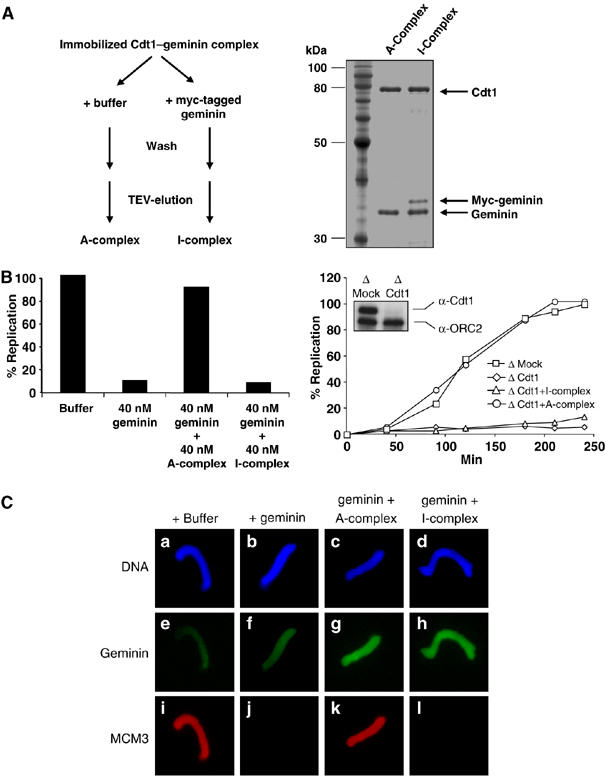
The stoichiometry of the Cdt1–geminin complex determines its active and inactive state. (A) Left panel: diagram explaining the formation of the ‘A'- and ‘I'–Cdt1–geminin complex. Right panel: SDS–PAGE of the active A-complex and the inactive I-complex, which contains additional bound myc-tagged geminin. Also shown is a molecular weight marker. (B) Left panel: percentage of replicated sperm chromatin after 100 min in egg extract supplemented by buffer, 40 nM geminin, 40 nM geminin plus 40 nM A-complex, or 40 nM geminin plus 40 nM I-complex. Right panel: kinetics of DNA replication in either Mock-depleted extract (squares) or in Cdt1-depleted extract supplemented by buffer (diamonds), 40 nM A-complex (circles) or 40 nM I-complex (triangles). The insert shows a Western blot for Cdt1 and ORC2 (as loading control) of Mock- and Cdt1-depleted extract. (C) Immunofluorescence of sperm chromatin incubated for 20 min in egg extract complemented with buffer or equal amounts of either geminin alone, the A–Cdt1–geminin complex or I–Cdt1–geminin complex in addition to geminin. DNA is shown in blue (Hoechst), geminin in green (FITC) and MCM3 in red (Texas red).