
Figure 7.
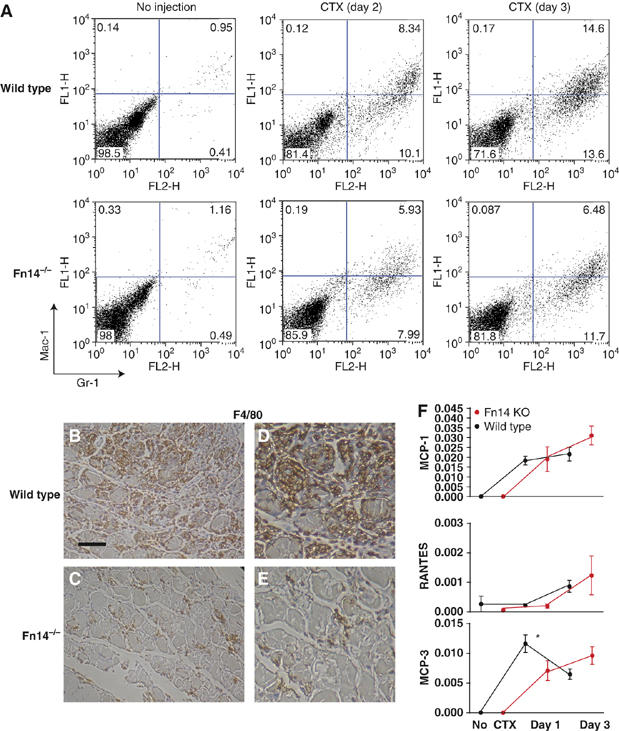
Altered inflammatory response in Fn14−/− muscles in response to cardiotoxin (CTX) injury. (A) FACS based on myeloid markers Mac-1 and Gr-1 showed that inflammatory cells were more abundant in wild-type than in Fn14−/− muscles at 2 and 3 days post injury. Slightly more cells were consistently recovered from wild-type than Fn14−/− mice at all time points; the same number of cells (10 000) are shown in each dot plot. For each genotype, cells from two mice were pooled for each time point and the results shown are representative of three independent experiments. (B–E) F4/80 expression (brown staining) of muscle tissue cross-sections shows higher numbers of inflammatory cells in wild-type (B) than in Fn14−/− (C) muscles on day 3 following cardiotoxin. Detailed views of (B) and (C) are shown in (D) and (E), respectively. Scale bar: 100 μm (B, C), 50 μm (D, E). (F) mRNA levels of MCP-1, MCP-3 and RANTES with and without cardiotoxin injection in wild-type and Fn14-deficient mice. At 1 and 3 days after cardiotoxin, total RNA was isolated from TA muscles (n=3) and quantitative PCR was used to quantify mRNAs. Asterisk indicates that the difference for MCP-3 expression at day 1 reached statistical significance (P<0.05, by Student's t-test).