
Figure 5.
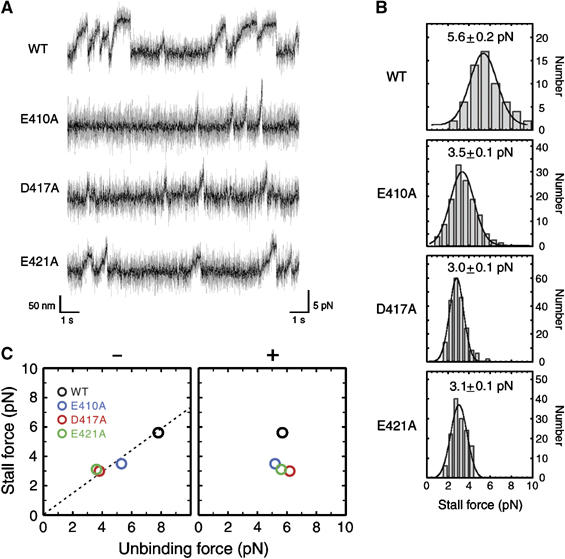
Stall force measurement. (A) Representative tracing of a trapped bead powered by a conventional two-headed kinesin along the wild-type, E410A, D417A, and E421A microtubules, measured at the trap stiffness of 0.076 pN/nm. Light shaded, unfiltered; solid, filtered at 100 Hz. (B) Distribution of the stall force for wild-type and mutated microtubules. The average stall force with s.e.m. is shown in each panel. Total number of events counted are (from top to bottom) 61, 104, 102, and 69, respectively. (C) The stall force plotted against the unbinding force for minus- (left) and plus-end loading (right). The stall force was linearly related to the unbinding force for minus-end loading (linear coefficient; 0.73).