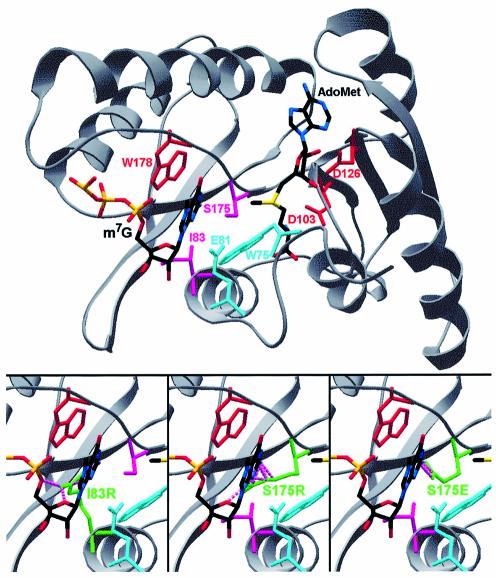
Figure 3.
Homology model of Tgs1 shown in a ‘cartoon’ representation. Docked ligands (AdoMet and the N7-methylated guanosine) and residues studied by mutagenesis are shown in the a ‘wireframe’ representation. Red indicates indispensable side chains (corresponding to inactive alanine mutants); pink indicates positions in which non-conservative substitution with bulky side chains abrogate the MTase activity (see also Bottom); cyan indicates bulky side chains, which are dispensable for the MTase activity. (Bottom) Models of I83R, S175R and S175E mutants predicted to block the active site and abrogate the substrate binding. Mutated residues are shown in green. Steric clashes with m7G are shown as pink broken lines.

