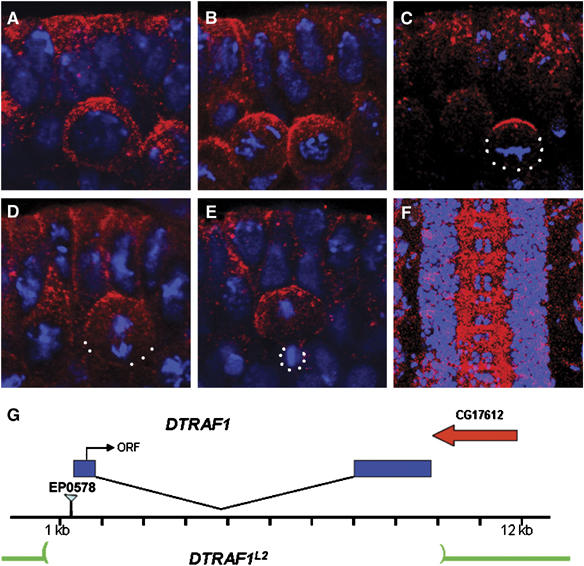
Figure 1.

DTRAF1 expression in the embryonic CNS. Stage 10 (A–E) and stage 15 (F) WT embryos are double stained with anti-DTRAF1 (red) and DNA (blue). In interphase, DTRAF1 is cytoplasmic in NBs (A). After NB enters mitosis, DTRAF1 is apically enriched during prophase (B) and forms a tight apical crescent at metaphase (C). At anaphase, the DTRAF1 apical crescent becomes less obvious and additional punctated cytoplasmic staining is visible (D). By telophase DTRAF1, both cortical and cytoplasmic, remains only in the large daughter cell (E). High levels of DTRAF1 are present in the axonal tracts of the ventral nerve cord (F). (G) A schematic diagram showing the DTRAF1 genomic region. The P-element EP0578 is inserted at 59 bp 5′ to the DTRAF1 transcribed region. The entire DTRAF1 coding region is removed in DTRAF1L2. White dots outline the cell body. Apical is up.
