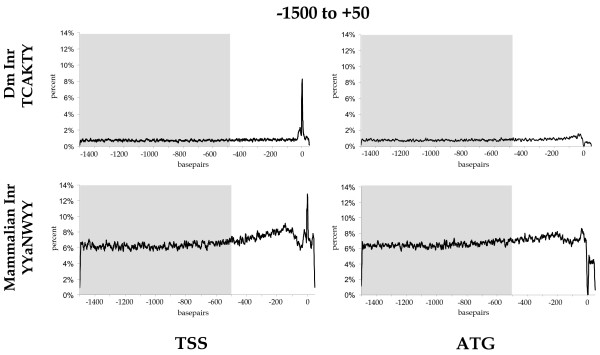
Figure 2.
Distribution curves of the transcription initiation motifs from mammals and Drosophila in promoter datasets of Drosophila. The motif distribution curves of the transcription initiation motif (Inr) of Drosophila TCAKTY [24] and of mammals YYANWYY [25] were constructed on 7954 automatically assembled sequences derived from NCBI [59]. Relative number of motifs per site (in percent) was mapped to their respective position. The grey box indicates the region used to calculate the background average and its SD.

