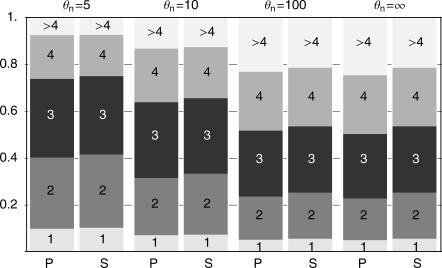
Figure 3. Probability of Finding 1, 2, 3, etc., Distinct Haplotypes Depending on the Neutral Mutation Rate θn , in a Sample of 20 at the Time of Fixation, with θb = 1.0.
Predictions from Equation 2 are labeled P; simulation results are labeled S. Simulations are done without recombination and neutral mutations during the selective phase.

