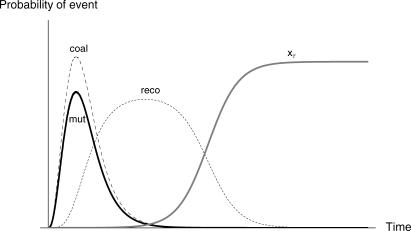
Figure 4. Timing of Coalescence, Recombination, and Mutation Events during the Selective Phase in a Sample of Two.
This plot shows the probability that recombination (reco), mutation (mut), or coalescence (coal) happens during the selective phase when we trace the ancestry of a sample of size 2 back in time. The parameter values for this plot are chosen so that the timing of the three events is made clear; no importance should be given to the relative heights of the curves. The curve with label xτ shows the frequency of the B allele in the population.

