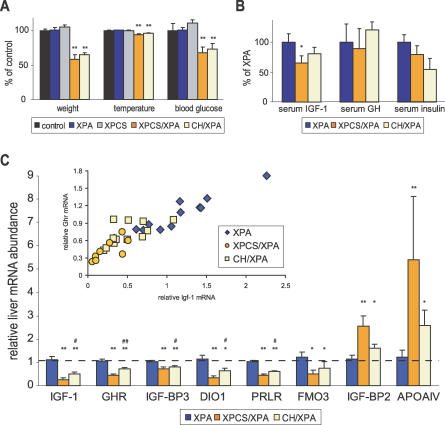
Figure 4. Perturbation of GH/IGF-1 Axis Correlates with Severity of NER Progeria.
(A) Body weight, temperature, and whole blood glucose of anesthetized WT control (n = 4, black); single mutant XPA (n = 23, blue) and XPCS (n = 6, grey); and double mutant XPCS/XPA (n = 6, orange) and CH/XPA (n = 13, beige) animals relative to WT controls. Asterisks indicate statistical significance versus WT controls (**, p < 0.01); error bars indicate SEM.
(B) Serum IGF-1, GH, and insulin as determined by ELISA in XPCS/XPA (n = 5) and CH/XPA (n = 7) relative to XPA (n = 6) animals. Asterisk indicates statistical significance versus XPA controls (*, p < 0.05); error bars indicate SEM.
(C) Abundance of liver mRNAs encoding IGF-1, GHR, IGF-BP3, DIO1, prolactin receptor (PRLR), FMO3, IGF-BP2, and APOAIV in XPCS/XPA (n = 8) and CH/XPA (n = 12) relative to XPA (n = 12) mice as determined by quantitative real-time PCR. Asterisks indicate statistical significance versus XPA controls (*, p < 0.05; **, p < 0.01); pound signs indicate statistical significance between XPCS/XPA and CH/XPA (#, p < 0.05; ##, p < 0.01); error bars indicate SEM. Inset: correlation between relative IGF-1 and GHR mRNA expression values in individual animals; correlation coefficients per group: XPA, 0.96 (blue diamonds); XPCS/XPA, 0.76 (orange circles); CH/XPA, 0.84 (yellow squares); overall, 0.92.

