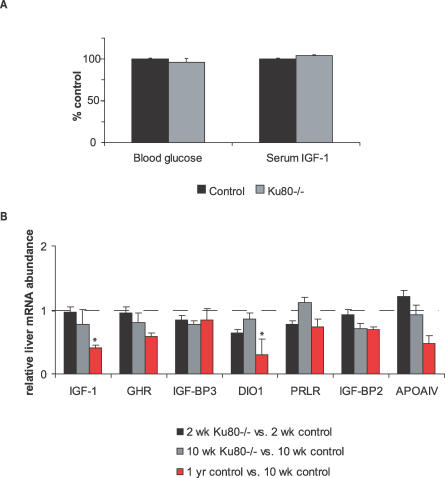
Figure 6. Analysis of Blood Glucose, Serum IGF-1, and Liver Gene Expression Profiling in NHEJ-Deficient Ku80−/− Mice.
(A) Glucose and IGF-1 levels in the blood serum of 2-wk-old Ku80−/− versus WT or heterozygous littermate controls. Error bars indicate SEM; six animals were used per group.
(B) Abundance of liver mRNAs encoding IGF-1, GHR, IGF-BP3, DIO1, prolactin receptor (PRLR), FMO3, IGF-BP2, and APOAIV) in 2-wk-old Ku80−/− (n = 6) versus 2-wk-old WT or heterozygous littermate controls (n = 6); and both 10-wk-old Ku80−/− (n = 4) and ∼1-y-old versus 10-wk-old controls (n = 5) as determined by quantitative real-time PCR. Error bars indicate SEM between experiments.

