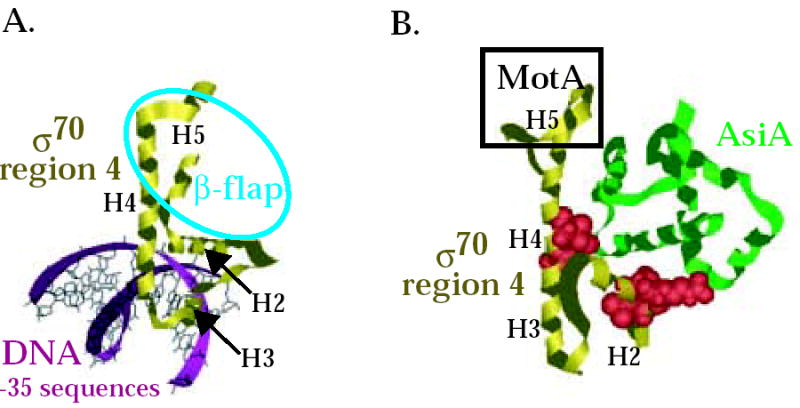
Fig. 6.

Interaction of σ70 region 4 with -35 element and the β-flap versus its interaction with AsiA and MotA. Structures of (A) T. aquaticus σ region 4 (residues corresponding to E. coli σ70 residues 546-612) with the –35 region of promoter DNA 8 (PDB: 1KU7) and of (B) E. coli σ70 region 4 (residues 546-613) with AsiA (residues 2-90) 30 (PDB: 1TLH). σ70 region 4 is shown in gold, AsiA is shown in green, and the DNA is shown in magenta. Alpha helices H2, H3, H4, and H5 in σ70 (see Fig. 1A) are labeled. Spacefill structures of σ70 residues 551, 554, and 555 in region 4.1 and residues 584 and 587 in region 4.2, which are predicted to interact with AsiA in the structure and whose substitution impairs the σ70/AsiA interaction, are shown in red in (B). The portion of σ70 region 4 that interacts with the β-flap is indicated by the blue oval in (A). H5 of σ70 that interacts with MotA is indicated by the black rectangle in (B). Note that the binding of AsiA to σ70 region 4 converts H3-T-H4 of σ70, which normally interacts with the –35 sequences of promoter DNA, into one continuous helix.
