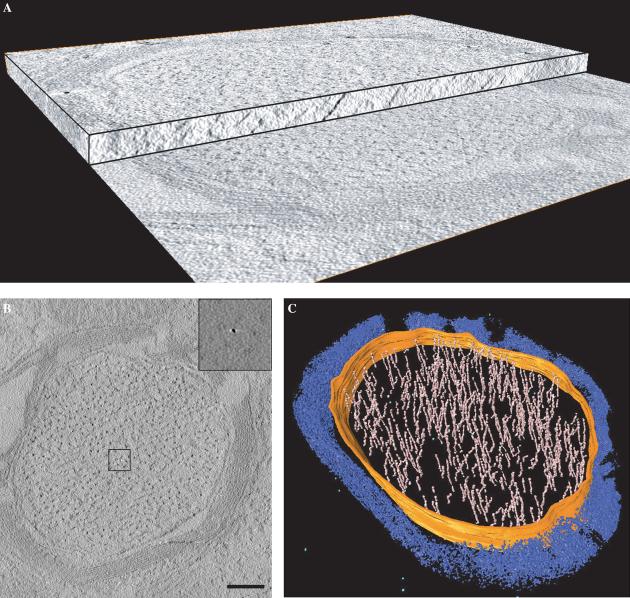
Fig. 4.
3D imaging of wild-type neuronal axons by electron tomography. (A) Cut-away view of a tomogram obtained from a 150 nm thick mouse brain section prepared using 0.05% osmium as a fixative. The tomogram is composed of a stack of slices representing the 3D structure of the section. A single slice from the tomogram is shown in (B). The contrast in the slice was computationally enhanced to show the myelin sheath and filaments inside the volume. The insets show that ferritin molecules can be easily detected in the raw tomographic slices when no contrast enhancement is applied. (C) Volume-rendered representation of a myelinated axon from a wild-type mouse. 3D tomographic volume is partially segmented within the axon region for neurofilaments (pink), axonal membrane (orange), and ferritin molecules (light blue). Myelin sheaths and other unsegmented regions are in blue. Scale bar 250 nm.

