
Fig. 6.
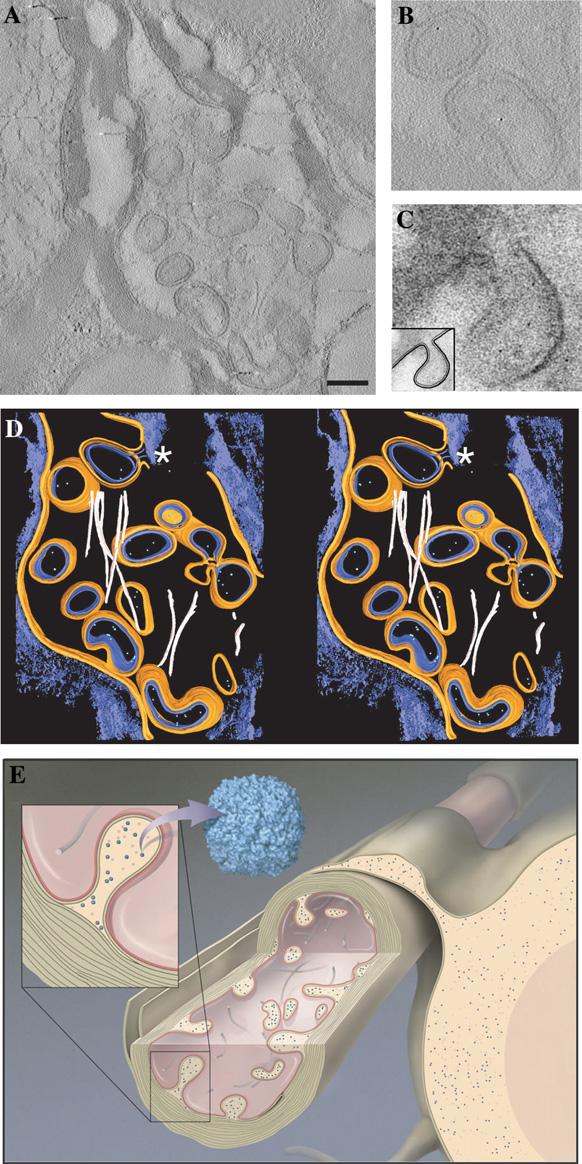
Electron tomography of degenerating neurons in an IRP knockout mouse brain. (A) A single tomographic slice showing invasion of the interior of the axon by what appear to be “double-walled vesicles.” The tomogram was recorded from a 150 nm thick slice from brain tissue. Scale bar 250 nm. (B) Enlarged views of a selected slice from the tomogram illustrating the presence of ferritin within these double-walled regions. (C) Enlarged view of a small region of a projection image recorded from a 70 nm slice showing the emergence of a double-walled vesicle from the junction of the axonal membrane and oligodendrocyte membrane at the innermost layer of the myelin sheath. The inset shows a schematic representation of this double-walled invagination. (D) Volume-rendered representation of the axonal section in stereo from the IRP knockout mouse axon, displaying the axonal membrane in orange, the oligodendrocyte membrane in blue, neurofilaments in pink, invaginated double-walled vesicles containing the oligodendrocytic cytoplasm and ferritin molecules in green. The myelin sheath and other unsegmented regions are in blue. The asterisk indicates a double-walled vesicle emerging from the junction of the two membranes. (E) Cartoon of axon and oligodendrocyte cell showing the anatomy of degeneration based on our electron tomographic studies of the IRP knockout mice. The blue dots represent ferritin particles.