
FIG. 2.
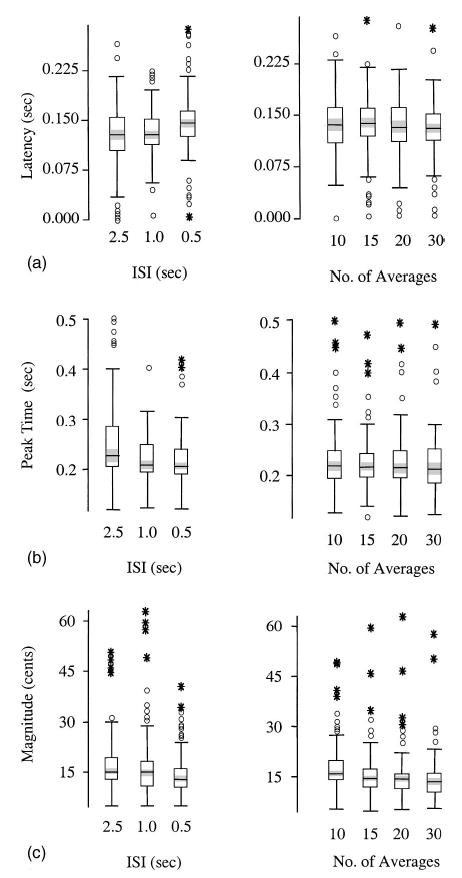
(a) Median box-plots of response latency (s) by ISI and number of averages (N=31). (b) Median box-plots of responses peak time (s). (c) Median box-plots of response magnitude (cents). Box-plot definitions: The horizontal line through a box is the median. The shaded region surrounding the median is the 95% confidence interval. The upper and lower limits of the box represent the 75th and 25th percentiles, respectively. Whiskers extend to upper and lower limits of the main body of data. Points depicted by a circle are considered to be extreme data values, while very extreme values are plotted as asterisks.