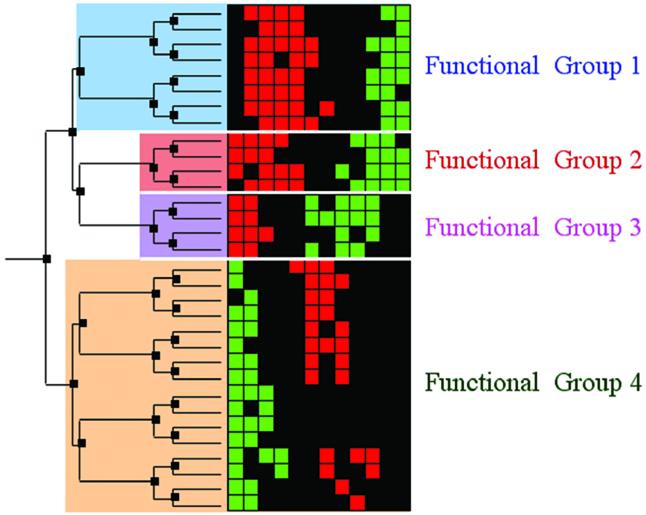
Figure 1.

Hierarchical clustering and cluster boundary definition. A schematic of hierarchically clustered expression data with subsequent cluster boundary definition. On the right are gene expression data represented as a colored grid. Each row in the grid represents the expression of a single gene across multiple conditions; each column represents the expression of each of the genes in a specific condition. Red squares indicate gene induction, while green squares indicate repression. On the left is a tree generated by a hierarchical clustering algorithm. The tree consists of nodes (dark boxes) that organize the genes according to expression similarity. All of the genes that descend from one node are the genes in the candidate cluster defined by that node. In this schematic, we illustrate a pruning of the tree into four disjoint biologically relevant gene clusters. Pruning the tree defines concrete clusters and their boundaries. After clustering the data, one must identify the biologically significant candidate clusters. Typically, careful expert examination of the genes in the clusters is required to identify the critical clusters in which the genes share function and to draw cluster boundaries that respect biological function. We assert that scientific literature can be mined automatically instead to identify biologically consistent clusters, and to draw cluster boundaries that respect biological function.
