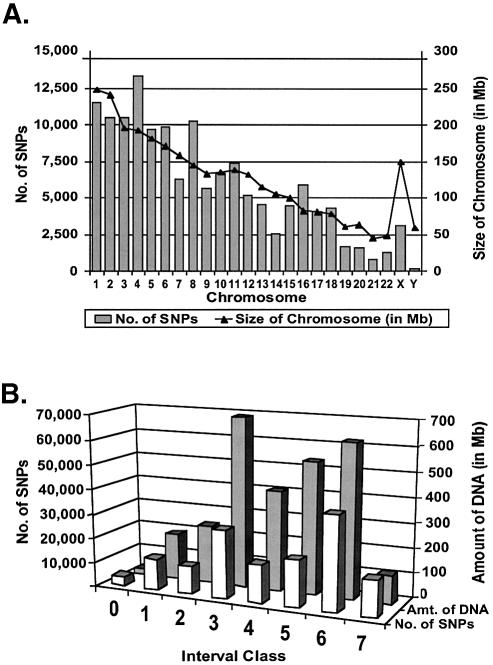
Figure 1.
Analysis of 140 696 new SNP candidates. (A) The bar graph depicts the genomic distribution of our 140 696 SNP candidates by chromosome. Note that the SNPs are distributed on all 24 chromosomes proportional to the amount of DNA (indicated by a line above the bar graph). The possible exceptions are the X and Y chromosomes, which have fewer SNPs than average per kb of DNA. The distribution of our SNPs also was examined relative to genes (see Materials and Methods). Overall, 49.7% of our 140 696 SNPs fell within or near genes (defined as being within 3 kb of a gene or predicted gene in the upstream direction, or within 500 bp of a gene or predicted gene in the downstream direction). In comparison, 45.2% of all SNPs in the equivalent build of dbSNP (build 113) fell within such regions using the same criteria. Thus, the overall distribution of our SNPs relative to genes was highly similar to the overall distribution of all SNPs in the same build of dbSNP. (B) The row of white bars (front) shows the number of SNPs from our collection in interval classes 0 through to 7 (defined in Table 1). The row of black bars (back) depicts the amount of DNA (in Mb) contained within each class before adding our SNPs to the map (listed in Table 1 under ‘Total length’ column). Note that our SNPs occur in all classes, and are generally proportional to the amount of DNA in each class. The 51 770 SNPs in classes 6 and 7 close many of the largest gaps in the SNP map, and the 85 757 SNPs in classes 4–7 are likely to be immediately useful for construction of the HapMap. The SNPs in classes 0–3 may be useful in cases where the allelic frequencies of existing SNPs are unfavorable.

