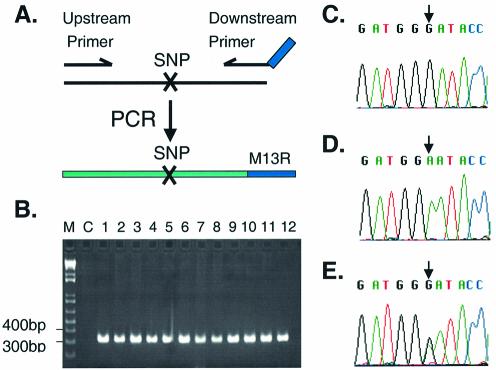
Figure 2.
Strategy for SNP validation. (A) The diagram shows the strategy used to amplify each SNP candidate by PCR. A recombinant PCR product is generated by introducing the M13R sequence into the downstream primer. (B) A gel showing PCR products generated for a typical SNP (SNP 9 is shown, generating a PCR product of 319 bp in length). Note the robust PCR products in lanes 1–12, and the absence of a band in the negative control lane (C). A 1 kb ladder marker is shown on the left (M). (C–E) Examples of chromatograms from SNP 9 (a ‘C’ is present at position 67 671 151 of chromosome 8 according to our predictions, whereas a ‘T’ is present in the Golden Path. The sequences shown are of the complementary strand. Arrows show the single nucleotide of interest. (C) Homozygous for our prediction based on the TSC trace sequence (human sample 3). (D) Homozygous for the Golden Path (human sample 6). (E) Heterozygous for our prediction and the Golden Path sequence (human sample 5).

