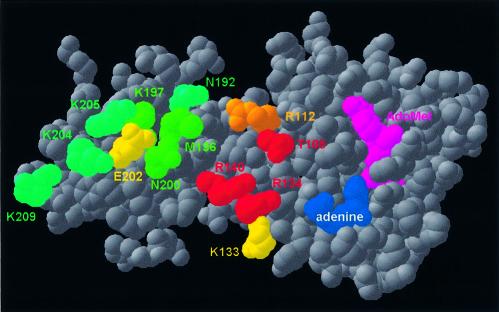
Figure 3.
ErmC′ structure (5) shown in the ‘spacefill’ representation, reflecting van der Waals radii of non-hydrogen atoms. Residues analyzed by mutagenesis in this work are colored according to the effect of the mutation: red, in vitro activity (A) < 5%; orange, 5% < A < 20%; yellow, 20% < A < 60%; green, 60% < A < 80%; teal, A > 80%.

