Figure 1.
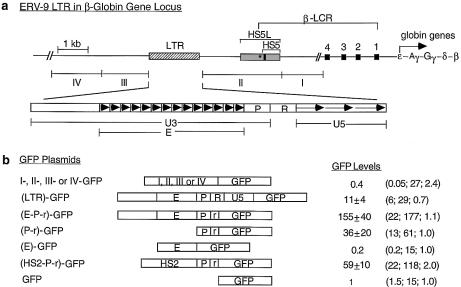
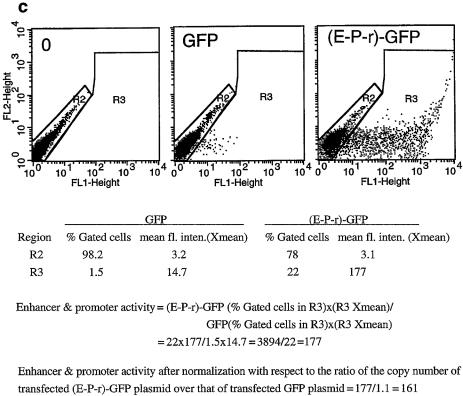
(Opposite) Structural and functional analyses of the 5′ boundary area of the human β-LCR. (a) Map of the ERV-9 LTR and the 5′ boundary area of the human β-LCR. Hatched box, LTR; stippled box, HS5L, the 1.2 kb HS5 site; vertical bar, CTCF binding site; *, NF-E2 binding site; HS5, the 0.5 kb HS5 site (see Table 1 for constructs containing HS5L or HS5); solid boxes, DNase I hypersensitive sites HS4, HS3, HS2 and HS1 of the β-LCR. The 9 kb DNA between // signs is drawn to scale; the 65 kb DNA to the right of // spans the β-LCR and the human β-like globin genes and is not drawn to scale. DNA fragments I, II, III and IV, DNAs in the boundary area that flank the LTR. The LTR is enlarged to show the U3, R and U5 regions. E, the U3 enhancer spanning 14 tandem repeats of 40 bp each denoted by the arrowheads; P, the 90 bp U3 promoter; open box to the left of E, the 590 bp of U3 GC-rich DNA 5′ of the enhancer; horizontal arrows, the three tandem repeats of ∼80 bp each in U5. (b) Maps of the recombinant GFP plasmids containing subfragments of the 5′ boundary area, I-, II-, III- and IV-, the LTR and components of the LTR. (HS2-P-r)-GFP contained the HS2 enhancer, the U3 promoter and the 5′ half of the R region of the 5′HS5 LTR coupled to the GFP gene. GFP, the reference enhancerless and promoterless GFP plasmid. The third column gives the GFP levels of the test plasmids relative to that of the reference GFP plasmid in transfected cells; values are averages of two determinations. For the I-, II-, III- and IV-GFP plasmids, the representative values of the III-GFP plasmid are presented; the GFP levels of the I-, II- and IV-GFP plasmids were even lower, in the 0.2–0.4 range, and are not shown. The three numbers in parentheses are, respectively, the percentage of fluorescent cells, the mean fluorescence intensities of the fluorescent cells [see (c)] and the ratio of the plasmid copy number of the transfected test plasmid to that of the reference GFP plasmid. (c) Sample calculation of the enhancer/promoter activity of the transfected (E-P-r)-GFP plasmid. (Left, middle and right) Dot plots by FACS analyses of K562 cells transfected with Tris buffer and GFP and (E-P-r)-GFP plasmids, respectively. x-axis, GFP fluorescence intensities of the transfected cells; y-axis, FL2 channel. The dot plots are the same whether FL2 or side scatter was used as the y-axis in the Cellquest program. However, using FL2 as the y-axis produced more compact and thus more easily gated fluorescent and non-fluorescent cell populations. R2 region, non-fluorescent cells; R3 region, fluorescent cells. The table below the dot plots gives quantitative analysis by the Cellquest program of the dot plot data. Xmean, mean fluorescence intensities of the gated cells. (Bottom) Calculation of the enhancer/promoter activity of (E-P-r)-GFP in K562 cells.


