Figure 2.
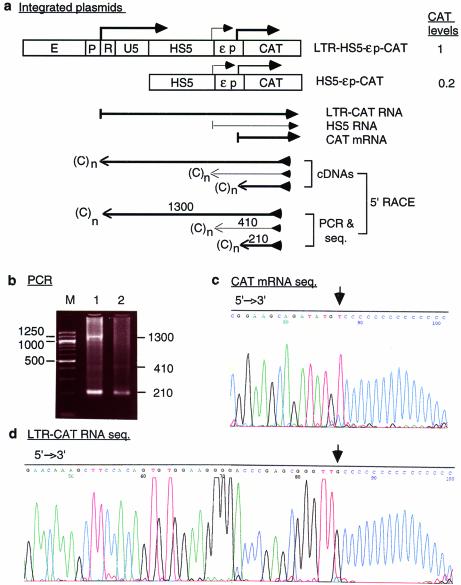
(Opposite) Transcription of integrated plasmid LTR-HS5-εp-CAT in K562 cells. (a) Maps of the integrated LTR-HS5-εp-CAT and HS5-εp-CAT plasmids and transcription of the plasmids analyzed by 5′-RACE. Angled arrows, locations of transcriptional initiation sites in the LTR, HS5 site and the ε-globin promoter. Left to right arrows, RNAs initiated from within the LTR, HS5 and ε-globin promoter, with the thickness of the arrows showing the relative abundance of the RNAs. Right to left arrows, cDNAs reverse transcribed from the respective RNAs and PCR fragments subsequently amplified from the cDNAs by the 5′-RACE protocol. The PCR fragments depicted were the sequenced DNA strand; the arrows are aligned with the plasmid map on top. (C)n, poly(dC) tails added to the 3′ end of the cDNAs by the TdT enzyme. The arrowheads at the 5′ ends of the cDNA or the PCR fragment indicate the reverse primers used for cDNA synthesis, PCR amplification and DNA sequencing. Numbers are the sizes in nucleotides of the PCR fragments determined by gel electrophoresis and DNA sequencing [see (b), (c) and (d)]. CAT levels are relative levels of CAT enzyme produced by the LTR-HS5-εp-CAT plasmid (at 8 copies/cell) and HS5-εp-CAT (at 14 copies/cell) determined previously by CAT assay (19). (b) PCR products of 5′-RACE. Lanes 1 and 2, PCR bands generated by RNAs transcribed, respectively, from the LTR-HS5-εp-CAT and HS5-εp-CAT plasmids; M, 100 bp size markers. Numbers on the right and left margins are sizes in bp of the PCR fragments and the size markers. (c) DNA seqence of the 210 bp PCR fragment generated from CAT mRNA. The base marked by the arrow is the 5′ end/initiation site of CAT mRNA. (d) DNA sequence of the 1300 bp PCR fragment generated from the long LTR RNA; only the 5′ end of the sequence is shown. Arrow, 5′ end/initiation site of the LTR RNA. (e) DNA sequences near the transcriptional initiation sites of the LTR RNA and CAT mRNA. AATAAA, TATA box in the U3 or the ε-globin promoter; angled arrows, locations of transcriptional initiation sites; bold bases, transcribed bases.


