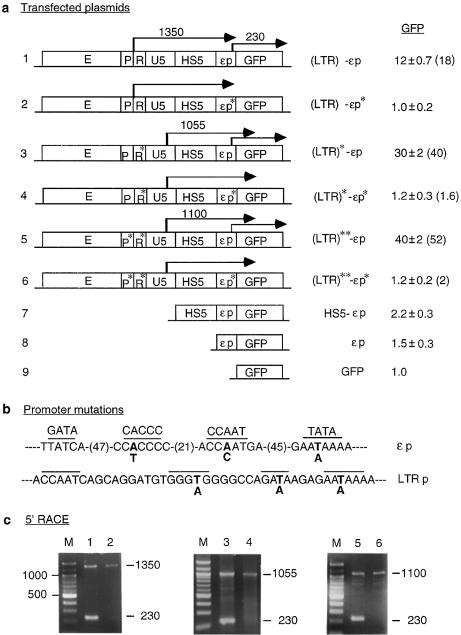
Figure 3.
Effects of mutations in the LTR and the ε-globin promoters on transcription of LTR RNAs and GFP expression. (a) Maps of plasmids containing promoter mutations. P*, R* and εp*, mutated LTR promoter, R region and ε-globin promoter (see Materials and Methods and Fig. 3b). (LTR)* and (LTR)**, the LTR containing mutations in only the R region and in both the R region and LTR promoter, respectively. Angled arrows, LTR initiated long RNAs and GFP mRNA, with locations of the angled arrows marking transcription initiation sites mapped by 5′-RACE; the numbers above the arrows are the sizes in nucleotides of the 5′-RACE bands. Numbers in the column under GFP are GFP levels of transiently transfected plasmids expressed with respect to the GFP level of the enhancerless and promoterless GFP plasmid; the values are averages of two transfection experiments. Numbers in parentheses are GFP levels of integrated plasmids. Other designations are as in Figure 2a. (b) Mutations in the ε-globin and LTR promoters. Overlined bases, sequence motifs important to the function of the respective promoters. Bold letters, DNA bases in the promoters that were mutated to the bases below. In the ε-globin promoter, numbers in parentheses are the number of bases between the overlined motifs. (c) 5′-RACE. Lanes 1–6, 5′-RACE bands generated by RNAs transcribed from the transfected constructs 1–6; numbers on the right margins are sizes in bp of the 5′-RACE bands.

