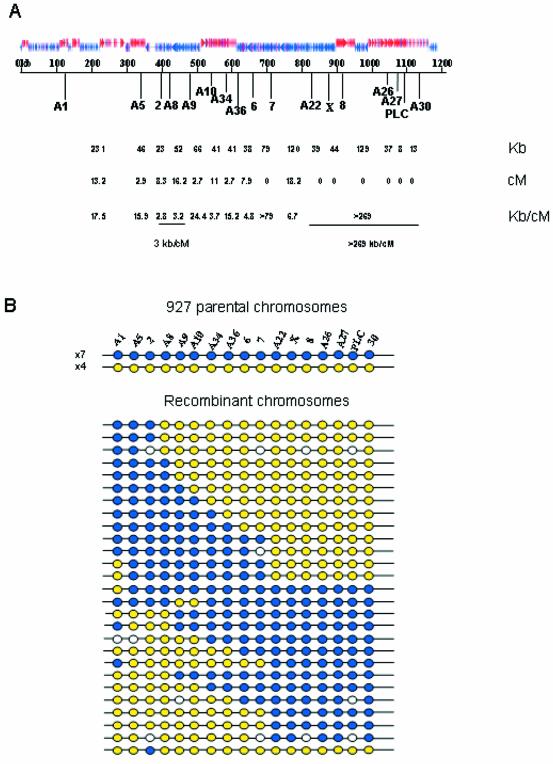
Figure 2.
(A) The physical map of chromosome II with the directional gene clusters and position of polymorphic mini- and microsatellite markers indicated. The physical distances between markers are shown (kb) and the genetic distances (cM) were calculated from recombination frequencies. Genetic distances shown are uncorrected. The relationship of physical and genetic maps to show hot and cold spots of recombination is also indicated (kb/cM). (B) Diagrams of the haplotypes of stock Tb927 showing 11 parental haplotypes shown as blue or yellow, and 27 recombinant types. White circles are unscored markers.

