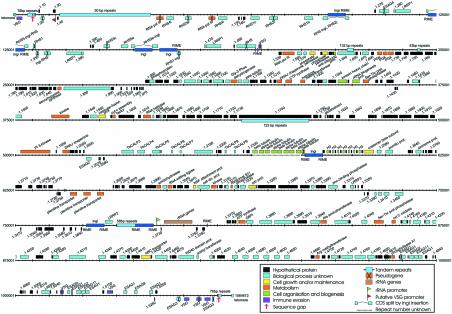
Figure 1.
Annotated features of the T.brucei chromosome I DNA sequence. The map shows the position and orientation of genes, putative CDSs, pseudogenes, DNA repeats and defined promoter sequences. All short CDSs (<150 codons) for which there is additional evidence of transcription (such as conservation in other species) are shown (see text). Coloured boxes above the central line represent genes oriented 5′→3′ left to right, and below in the reverse direction. The CDSs are coloured with respect to GO process categories: hypothetical proteins are predicted from DNA sequence alone, while proteins labelled ‘process unknown’ have homology to other proteins in T.brucei and/or other species but their biological process has not been defined.

