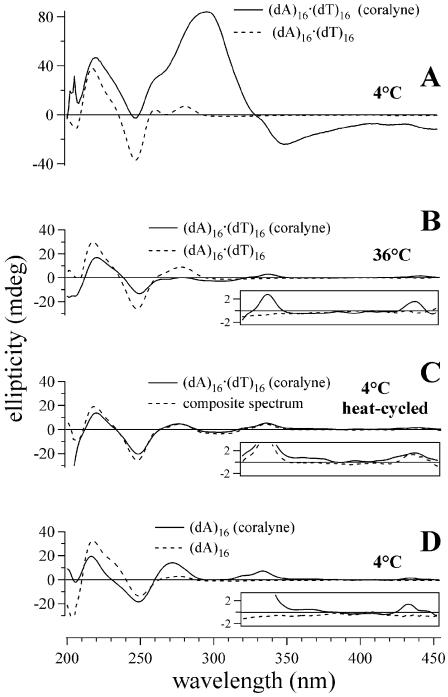
Figure 4.
CD spectra of duplex (dA)16·(dT)16 samples that illustrate duplex disproportionation. (A) Duplex (dA)16·(dT)16 sample with and without added coralyne at 4°C prior to heating. (B) Spectra of duplex (dA)16·(dT)16 samples with and without coralyne at 36°C. (C) Heat-cycled spectrum of disproportioned (dA)16·(dT)16 sample in the presence of coralyne at 4°C and composite spectrum {sum of spectra acquired at 4°C: [0.50 × triplex (dA)16·(dT)16·(dT)16 with 0.25 molar equivalents of coralyne] + [0.50 × single stranded (dA)16 with 0.25 molar equivalents of coralyne]}. (D) Spectra of (dA)16 sample with and without coralyne at 4°C. DNA concentrations were 55 µM nucleotide or base pair, respectively. Coralyne concentration was 0.25 molar equivalents per nucleotide or base pair, respectively.

