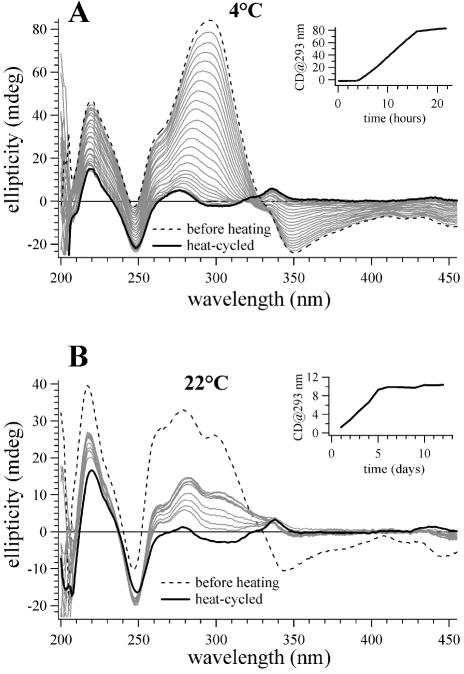
Figure 5.
CD spectra of a (dA)16·(dT)16 sample with coralyne that illustrate the approach of this sample to equilibrium at 4 and 22°C after being heat cycled to 75°C. (A) Spectra of the (dA)16·(dT)16 sample with coralyne at 4°C. The dashed line is the spectrum acquired immediately after the addition of coralyne at 4°C, before heat cycling. The solid black line is the spectrum acquired immediately after the sample was heated to 75°C and cooled back to 4°C. Spectra drawn in gray were acquired at selected time intervals after the sample was heat cycled. After heat cycling, the sample was constantly maintained at 4°C. (Inset) A plot of the CD signal at 293 nm as a function of time after sample heat cycling for the sample maintained at 4°C. (B) Spectra of the (dA)16·(dT)16 sample with coralyne at 22°C. The dashed line is the spectrum acquired immediately after the addition of coralyne at 22°C, before heat cycling. The solid black line is the spectrum acquired immediately after the sample was heated to 75°C and cooled back to 22°C. Spectra drawn in gray were acquired at selected time intervals after the sample was heat cycled. After heat cycling, the sample was constantly maintained at 22°C. (Inset) A plot of the best fit exponential function of the CD signal at 293 nm for the (dA)16·(dT)16 sample with coralyne at 22°C as a function of time after heat cycling. DNA concentration was 55 µM base pair. Coralyne concentration was 0.25 molar equivalents per base pair for both samples.

