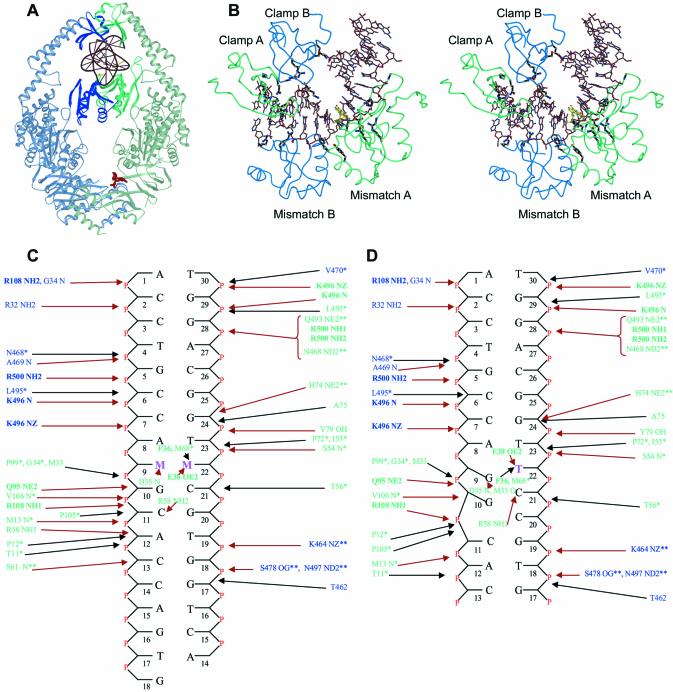
Figure 1.
DNA binding by MutS. (A) View of the MutS–DNA complex showing the DNA and ADP in red. The mismatch binding monomer (A) is coloured green and the other (monomer B) is coloured blue. (B) Stereo view of the protein–DNA interaction interface. The residues forming hydrogen bonds are coloured black. The mismatched bases are coloured yellow. (C) Schematic representation of the interactions between the mismatched DNAs and E.coli MutS. Residues from monomer A are shown in green and those from monomer B in blue. The bases marked M:M indicate the mismatches. Residues conserved in and making contacts to the DNA in Taq MutS (5) and also conserved in the eukaryotic homologs are indicated in bold and underlined. The residues conserved only in E.coli and Taq MutS and interacting with the DNA in the same way are shown with a single asterisk. Residues conserved in E.coli and Taq MutS but interacting with the DNA in a different way are shown with a double asterisk. Hydrogen bonds/salt bridges are shown with red arrows and Van der Waals interactions with black arrows. (D) Schematic representation of the interactions between the E.coli MutS–unpaired T.

