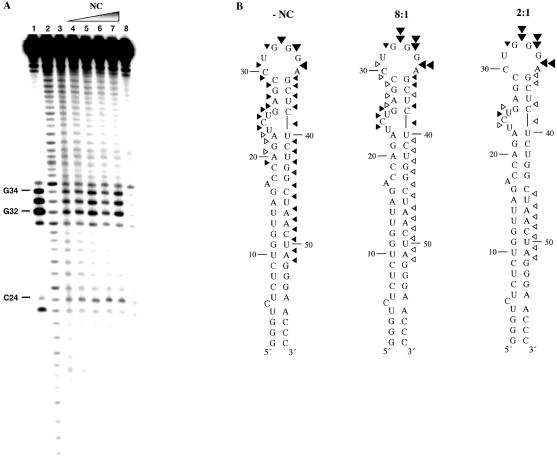
Figure 2.
(Opposite and above) Fe–EDTA footprinting of [32P]-TAR RNA in the presence of NC and with or without TAR DNA. (A) Footprinting experiments performed in the absence of TAR DNA. Lanes 1 and 2, RNase T1 and alkaline hydrolysis ladders of radiolabeled TAR RNA, respectively. Lane 3, Fe–EDTA cleavage profile of 1 µM [32P]-TAR RNA in the absence of NC. Lanes 4–7, cleavage profiles of 1 µM [32P]-TAR RNA in the presence of the following concentrations of NC: 3.7 (lane 4), 7.4 (lane 5), 14.8 (lane 6) and 29.5 µM (lane 7) to achieve 16:1, 8:1, 4:1 and 2:1 nt:NC ratios, respectively. Lane 8, control reaction carried out in the absence of NC and Fe–EDTA. (B) Quantification of the Fe–EDTA footprinting results shown in (A) mapped onto the backbone of TAR RNA. Results of experiments in the absence of NC (left) and in the presence of 8:1 (middle) and 2:1 (right) nt:NC ratios are shown. Symbols represent the following extent of cleavage: 0.20–0.40% (open arrowheads), 0.41–0.70% (closed small arrowheads), 0.71–0.85% (closed large arrowheads) and 0.86–1.10% (double arrowheads). (C) Footprinting experiments performed in the presence of TAR DNA. Lanes 1 and 2, RNase T1 and alkaline hydrolysis ladders, respectively. Lanes 3 and 4, cleavage profiles of 1 µM [32P]-TAR RNA in the absence and presence of 1.5 µM TAR DNA, respectively. Lane 5, cleavage profile of TAR RNA in a heat-annealed TAR RNA/DNA complex. Lanes 6–8, TAR RNA was preincubated for 30 min with TAR DNA and the following concentrations of NC prior to Fe–EDTA cleavage: 9.7 (16:1 nt:NC), 19 (8:1 nt:NC) and 39 µM (4:1 nt:NC). Lane 9, control reaction carried out in the absence of NC and Fe–EDTA. (D) Quantification of the Fe–EDTA footprinting results shown in (C), lanes 5 and 8, mapped onto the backbone of TAR RNA for the NC-annealed (4:1 nt:NC ratio, left) and heat-annealed (right) TAR RNA/DNA complex. Symbols have the same meaning as in (B).


