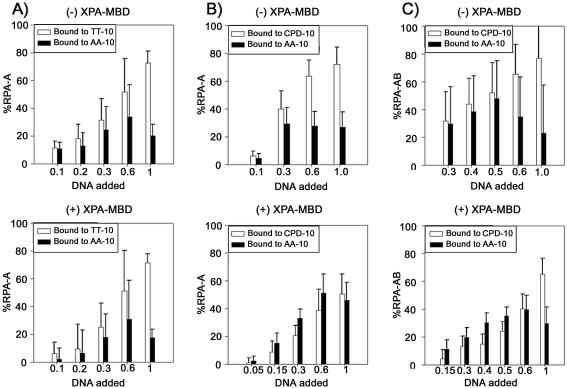
Figure 6.
(A) Binding of RPA-A to the TT/AA-10 duplex as a function of DNA concentration in the absence (upper) and presence (lower) of equimolar XPA-MBD. Populations of RPA-A binding to the TT-10 and AA-10 strands are represented by white and black bars, respectively. (B) Binding of RPA-A to the CPD/AA-10 duplex as a function of DNA concentration in the absence (upper) and presence (lower) of equimolar XPA-MBD. Populations of RPA-A binding to the CPD-10 and AA-10 strands are represented by white and black bars, respectively. (C) Binding of RPA-AB to the CPD/AA-10 duplex as a function of DNA concentration in the absence (upper) and presence (lower) of equimolar XPA-MBD. Populations of RPA-AB binding to the CPD-10 and AA-10 strands are represented by white and black bars, respectively.

