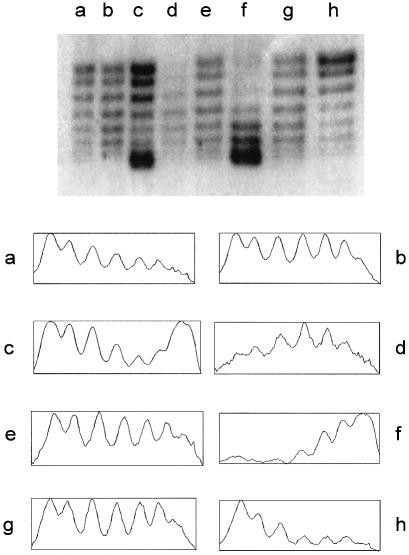
Figure 5.
(Top) One-dimensional chloroquine gel electrophoresis of pAO-oriT from MV10 strains. Cells also contained pUT1578 (lane a), pUT1210 (lane b), pUT1579 (lane c), pUT2001 and pUT221 (lane d), pUT2001 (lane e), pUT2000 and pUT221 (lane f), pUT2000 (lane g), or no other plasmids (lane h). (Bottom) Densitometric tracings of the topoisomer populations shown in the gel. The horizontal scale is approximately 400 pixels in each case; the vertical scale extends from the minimum to maximum value for the pixels in each case (vertical scale range is between 80 and 180).

