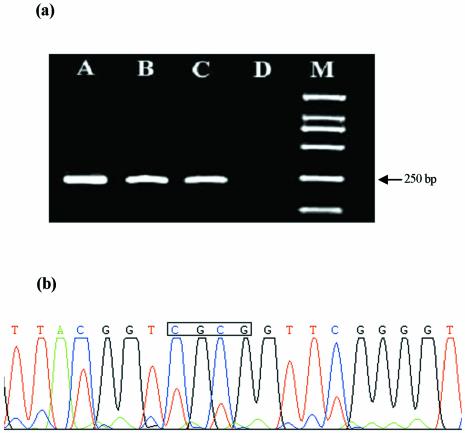
Figure 5.
(a) MSP of p16 gene. After treatment with bisulfate, amplification of DNA from gastric tumor tissue (A) and whole blood cells of healthy human (B) using unmethylated primer; amplification of DNA from gastric tumor tissue (C) and whole blood cells of healthy human (D) using methylated primer. Marker (M): from top to bottom, the bands are 2000, 1000, 750, 500, 250 and 100 bp, respectively. (b) Sequencing result of the PCR product with an ABI377A. The box indicates that the CpG sites in BstUI recognition sequence are methylated.

