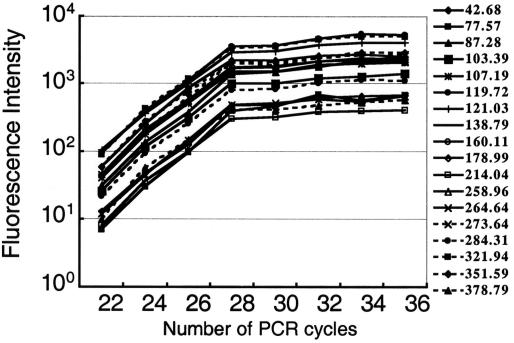
Figure 3.
Relationship between PCR cycle and length of PCR product for the intensity of fluorescence of each peak. The x-axis indicates the number of PCR cycles. The y-axis indicates the intensity of fluorescence of the PCR products. Results shown are representative peaks. The numbers on the right show the peak position that corresponds to the length of each fragment (base pair).

