Figure 4.
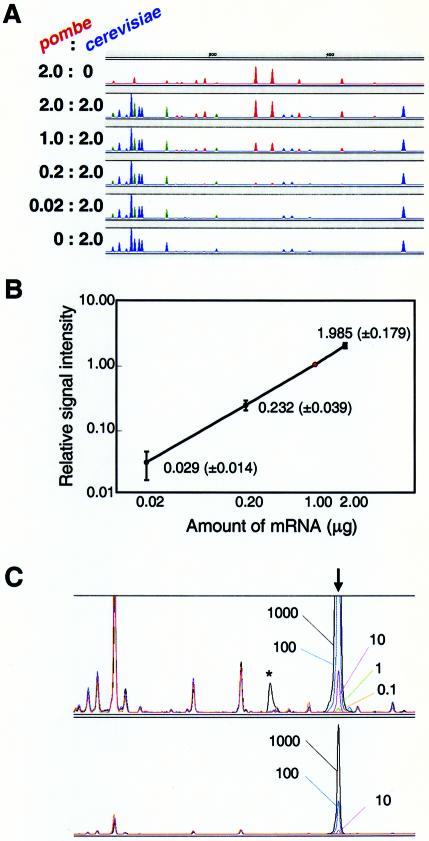
Dependency of the signal on the amount of mRNA. (A) Various mixtures of S.pombe and S.cerevisiae mRNAs (2.0:0.0, 2.0:2.0, 1.0:2.0, 0.2:2.0, 0.02:2.0 and 0.0:2.0 µg) were analyzed using HiCEP analysis. The peaks of S.pombe and S.cerevisiae mRNAs are shown in red and blue, respectively. Green indicates mixed peaks of S.pombe and S.cerevisiae. All panels except the top panel feature 2.0 µg of S.cerevisiae mRNA. Blue peaks are consistent with the peaks from 2.0 µg of S.cerevisiae mRNA. (B) Amount-dependent signal demonstrated by 100 randomly picked HiCEP peaks. We analyzed 100 S.pombe peaks (i.e. red peaks) for varying amounts of S.pombe mRNA and plotted their intensities relative to the intensities of the compounding peaks using 1.0 µg of S.pombe mRNA (indicated by the red dot). Average relative intensity and standard deviation are shown. (C) Minimum number of copies detected by HiCEP. Various amounts of poly(A) RNA, synthesized with an in vitro transcription system, were added during the total RNA extraction step for S.cerevisiae. HiCEP provided a peak for the synthetic RNA at the expected position (vertical arrow). Data from five independent experiments are overlaid. The amount of synthetic RNA added to each reaction is indicated by the number of copies per cell. Peak detection with diluted samples (factor of 1/10) is also shown in the lower panel. An asymmetric peak (asterisk) is found in the analysis at 1000 copies/cell. A saturated peak frequently generates a mechanical artifact (ghost peak) downstream.

