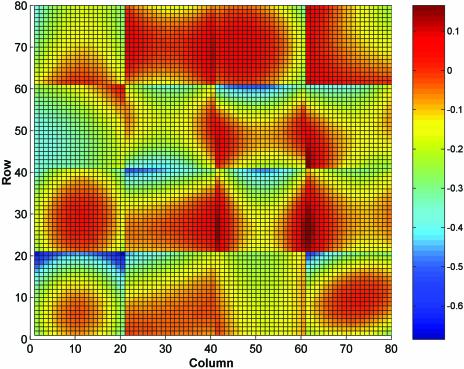
Figure 2.
We show the spot position-dependent error contribution from one of the yeast microarray chips used in this study. The data set has 6400 (80 × 80) data points grouped as 16 (4 × 4) blocks. Graduated colours are used to show the spatially averaged log ratio (base 2) obtained by fitting a 2D quadratic regression function to the log ratios from each block. Calibration of the colour scheme is shown by the bar on the right in log ratio units.

