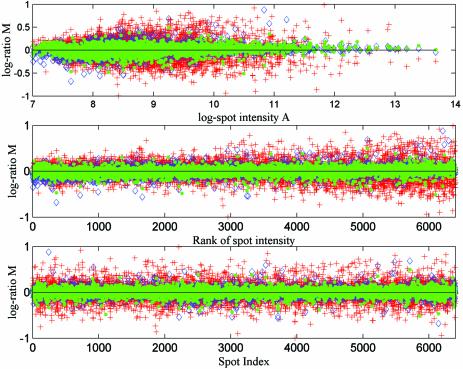
Figure 4.
We plot the estimated error for every spot after applying different normalisation approaches to reference treatment replicated yeast microarray data sets (iAN+RN, red crosses; SN+RN, blue diamonds; iAN+RN+FN, green dots). The error is defined as the difference in estimated log ratio (base 2) between replicated spots. In the top subplot the errors are plotted against mean log intensity. In the middle and bottom subplots the errors are plotted against spot index and rank, where the rank of spot intensity is obtained by sorting the data set by mean log intensity.

