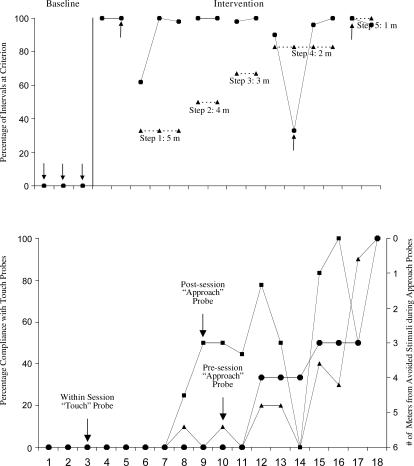
Figure 1. The top panel shows the percentage of recording intervals in which Rich remained at the specified distance criterion during baseline and intervention sessions (circles).
The distance criteria are depicted by the triangle data path. Arrows indicate sessions in which he exited the room. The bottom panel shows percentage of compliance with touch probes (circles) and pre- and postsession approach probes (triangles and squares, respectively) during baseline and intervention sessions.

